Some time ago a friend told me that writing my posts in English would be a good idea to reach more interested people and to improve my English skills. So it is time to start writing in English.
Core Dumped. Have you ever seen this message after your application crashes? Do you know that it is possible to get the inner state of your application after it crashed and debug it? Yes, it is possible with the core dump feature.
The core dump is a snapshot of the crashed process memory (with some processor’s info). It is a valuable tool to understand what generated the crash situation.
How to get the core dump
You must compile your application with debug symbols in order to get some useful information. Adding the debug parameter (“-g”) to the GCC compiler will generate these symbols for you.
This feature is usually disabled on most of the Linux distributions because the core dump files take space on the memory. The easy way to enable it is by running the following command on the target:
ulimit -c unlimited
This command sets the size of the core as unlimited. Use this command to disable it:
ulimit -c 0
The application must receive a signal from the kernel to generate the core file e.g. a segmentation fault. You can find a list of those signals in the signal man page.
Let’s see an example.
#include <stdio.h>

void f1(int *var){
    *var = 10;
}

int main(int argc, char *argv[]){
    printf("Application that crashes\n");
    f1(NULL);
    return 0;
}
Compiling this code with arm-linux-gnueabihf-gcc test.c -g -o test and running it on the target will generate the following message:
Application that crashes
Segmentation fault (core dumped)
The core file, in this case, is generated in the same directory as the application with the name “core”. You can change the following file “/proc/sys/kernel/core_pattern” to generate a different name. You need to set “1” in the “/proc/sys/kernel/core_uses_pid” to do this. Example:
echo 1 > /proc/sys/kernel/core_uses_pid
echo "/tmp/core-%e-%s-%u-%g-%p-%t" > /proc/sys/kernel/core_pattern
Go to the core man page to understand the name that will be generated and all “%” specifiers.
How to debug the core dump
Now with the core file in our hands, let’s see what it has inside it. GDB is a perfect tool to analyze it. Run the GDB from the toolchain that compiled the source code to open the core file. Sometimes “gdb-multiarch” works fine.
gdb-multiarch test core --tui
The first argument is your application (compiler’s output), the second one is the core file and the third one enables GDB’s “tui” mode in order to show the source code inside GDB. You need to open it from the source code folder to get the source code in GDB
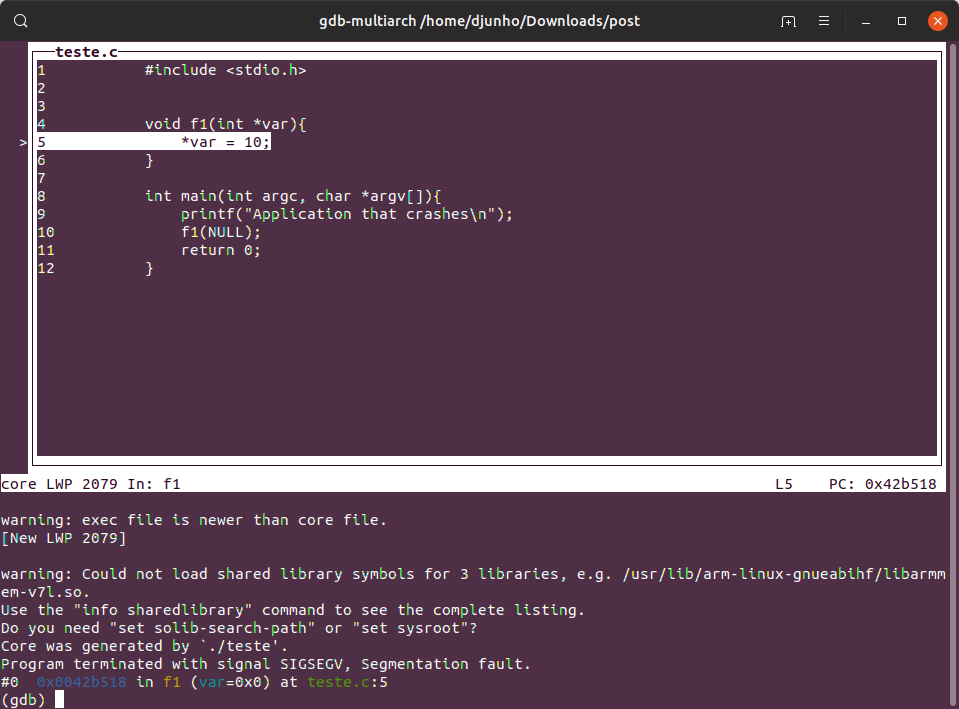
Then you should have something like this:

As you can see, it shows the exact line in which the application crashed. You can navigate through the GDB to see other useful information such as variables and the backtrace. But, this will be the subject of another post.
Comments